Supporting material for the Commentary
“How do simple connectionist networks
achieve a shift from ‘featural’ to ‘correlational’ processing in
categorisation?”
appearing in Infancy
Michael S. C. Thomas
Birkbeck College, University of London
Address for
correspondence:
Dr. Michael
Thomas
School of
Psychology
Birkbeck
College
University
of London
Malet St.
London WC1E
7HX, UK
tel.: +44
(0)20 7631 6207
fax: +44
(0)20 7631 6312
email: m.thomas@psychology.bbk.ac.uk
homepage: http://www.psyc.bbk.ac.uk/people/academic/thomas_m/
0. Abstract
In a commentary in Infancy, I evaluated three developmental connectionist models that simulate a purported shift from “featural” to “correlational” processing in infant categorisation (commentary: Thomas, 2004; models: Gureckis & Love, 2004; Shultz & Cohen, 2004; Westermann & Mareschal, 2004; empirical data: Younger, 1985; Younger & Cohen, 1986; for summary of target empirical data, see here). In this document, I present two simplified models that analyse the way in which the “featural” to “correlational” shift is achieved in the models presented in these articles. The first is a non-developmental mathematical model that fits the habituation data addressed by the articles with three free parameters: (1) a threshold to determine whether an item is a member of a known category or not; (2) the relative similarity of test items; and (3) a base rate 'level of surprise' to novel items. The second model is a stripped down Minimal developmental model of the “featural” to “correlational” shift in infant categorisation. This model employs a standard backpropagation network and an analysis of its internal representations across training demonstrates precisely the changes in processing structure that underlie the behavioural shift from responding according to features to responding according to correlations between features.
1. Non-developmental mathematical model
1.1. Introduction
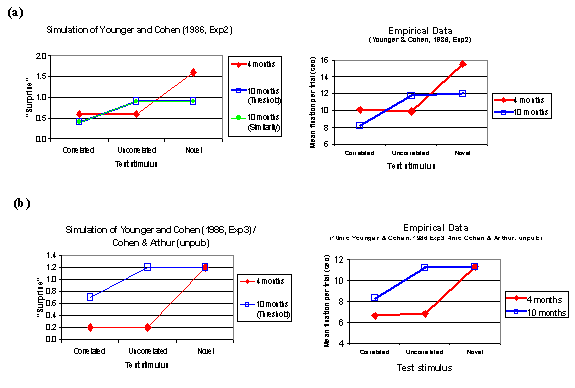
A recap of the empirical data: Two factors are apparent when one inspects the habituation data simulated by the infant categorisation models (see Figure 2). First, from 4 to 10 months there is a general reduction in overall looking time to the test stimuli: ten month olds seem less surprised by the test stimuli. Second, the main evidence taken to indicate a shift from “featural” to “correlational” processing is a modulation of the response to the uncorrelated novel item, that is, a novel item that shares features with those introduced in the familiarisation condition but has these features in a novel configuration (so violating the correlational structure). Compared to the correlated item (an item from the training set, or a novel item that respects the correlational structure of the training set) and an item with novel features, the uncorrelated novel item is found relatively more surprising at 10 months than it is at 4 months. This might be taken to imply greater sensitivity to correlational structure in the familiarisation set at the older age.
1.2. Conceptual assumptions of the (non-developmental) mathematical model
· Assume a continuum of similarity from correlated => uncorrelated => novel. Initially the uncorrelated item is partially similar to the items in the familiarisation set (i.e., to the correlated item) because it shares features with items in the familiarisation set.
· The infant has a threshold to determine which items fall within a known category formed from the items in the familiarisation set and which items fall outside the category as novel. Items outside the category prompt longer looking.
· At 4 months, this threshold is set low so that not only the familiar correlated item but also the partially similar novel uncorrelated item pass the threshold and are classified as ‘known’ and therefore uninteresting. The item with the novel features, however, fails to exceed the threshold, is classified as unknown and triggers additional looking.
· Based on these assumptions, the shift to the 10-month-old pattern could be due either to
o a change in the threshold so that the partially similar uncorrelated item no longer passes as 'known'
o a change in similarity so that the uncorrelated item no longer looks as similar to the items in the familiarisation set.
1.3. The model
Imagine a network with one input unit, one hidden unit, and one output unit (Figure 1). The input is connected to the hidden unit with a weight of strength 1. The hidden unit is connected to the output unit with a weight of strength 1. The hidden unit has a threshold which is used to decide whether the input is novel or not. This is implemented by a 'bias' unit contributing an activation of 1 and a weight set to the negative of the threshold value (i.e., you can be greater than the threshold, or greater than zero with the threshold value already taken away). The hidden unit passes its net input (the activity it receives from the input unit plus the bias) through a sigmoid function. The sigmoid has a low Temperature value of 0.3 (see Hinton & Sejnowski, 1986), giving it a sharp step-like categorisation function. The hidden unit works out its activation using the following equation.
![]()
In contrast, the output unit has a linear activation function, where its output is just the sum of its bias and the activation it receives from the input unit.
Figure 1. Architecture and parameters of
mathematical model
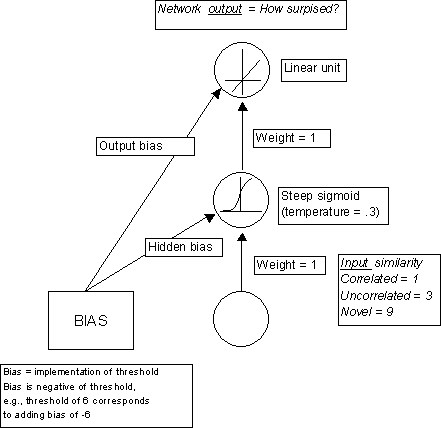
· Assume the activity of the output unit corresponds to the level of surprise / looking time exhibited by the infant. The bias on the output unit represents the base level of surprise of the system.
· Assume the similarity relations between the correlated, uncorrelated, and novel test items are initially represented as the input values 1, 3, and 9, so that the uncorrelated item is initially more similar to the correlated (familiarisation) item. [Values here are somewhat arbitrary but looking times could be scaled to actual data. The aim is to replicate the qualitative pattern. I haven’t gone to a lot of bother to achieve a precise replication of the data points, rather the aim is just to illustrate the principles of the model.]
· The hidden unit bias and the output unit bias are initially given values of –6 and +0.6, which reproduces performance at the 4-month-stage. [Example, 4-month old Correlated input pattern: Hidden netinput = Input x weight + bias = 1 x 1 –6 = -5. Hidden unit activity = this value passed through sigmoid function = 0.0. Output unit activity = netinput + bias = 0.0 + 0.6 = 0.6].
· THRESHOLD MANIPULATION: If the hidden bias is changed to –1 and the output bias to –0.1, the model now captures the qualitative pattern of the data for the 10-month-old stage (Younger and Cohen, 1986, Experiment 2). The effect of these bias changes is to alter the threshold of the hidden unit to turn the classification of the uncorrelated item to novel. (The following values allow the model to fit the data depicted in Shultz & Cohen, 2004, Figure 2, combining the results of Younger and Cohen, 1986, Experiment 3 and Cohen and Arthur, unpublished, cited in Shultz & Cohen, 2004: 4-month: hidden bias –6, output bias +0.2; 10-month: hidden bias –1, output bias +0.2).
· SIMILARITY MANIPULATION: Alternatively, the original hidden bias can be maintained (–6.0) and the 10-month-old data can be simulated by altering the relative similarity of the input patterns for correlated, uncorrelated, and novel patterns to 6, 8, and 9 respectively (the output bias still changes to –0.1 to reflect the reduction in the base rate level of surprise with age). This represents altering the similarity of the input patterns to re-classify the uncorrelated item as novel. The empirical data and simulated values are shown in Figure 2 (a) and (b).
Figure 2 Empirical data and simulation results from the simple mathematical model. (a) Simulation of data from Younger and Cohen (1986, Experiment 2). The 10-month-old pattern can be simulated either by altering the Threshold parameter or by changing the Similarity parameter. (b) Simulation of data from Younger and Cohen (1986 Experiment 3) for the 10 month olds, and Cohen and Arthur (unpublished) for the 4 month olds (see Shultz & Cohen, 2004, Figure 2), achieved with the Threshold parameter change.
2. Minimal developmental model of the “featural” to “correlational” shift in infant categorisation
2.1. Formulating the problem
First, let us formulate the baldest version of the problem domain, coded over just four features:
- A familiarisation set comprises two items, each with two features. The first item has feature 1 and feature 2 (f1, f2). The second item has feature 2 and feature 3 (f2, f3).
- During “featural” processing, so the story goes, a category will be formed such that an item is a member if it has any of the features f1, f2, f3. An item not in the familiarisation set, for example one that combines f1 and f3, will be identified as a category member even though it has these features in a configuration not experienced in the familiarisation set. By contrast, an item including a novel feature f4 will be identified as novel.
- During “correlational” processing, so the story goes, category members must not only contain previously encountered features but also those features in previously encountered configurations. Thus a category member must have f1 and f2 together, or f2 and f3 together. In this case, an item combining f1 and f3 will be seen as novel, as will an item including a novel features, such as f1 and f4.
- If the four features are coded by their presence or absence in binary format <f1, f2, f3, f4>, we reformulate the familiarisation set as vectors <1, 1, 0, 0> and <0, 1, 1, 0>.
- Let us take the first familiarisation item also to be the “correlated” test item. The test set then comprises the following vectors: the correlated item (f1, f2): <1, 1, 0, 0>; the uncorrelated item (f1, f3): <1, 0, 1, 0>; and the novel item (f1, f4): <1, 0, 0, 1>.
2.2. Model architecture
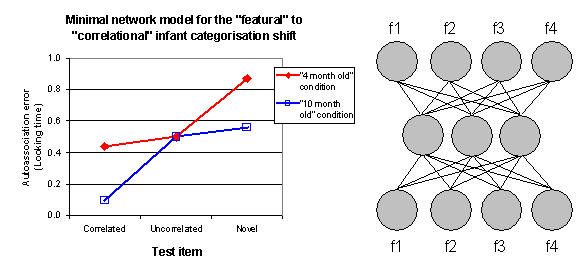
Following the assumptions of Mareschal and colleagues (see Westermann & Mareschal, 2004, for discussion), we use an autoencoder to capture the mechanism responsible for infant categorisation. Autoassociation error is taken to be equivalent to looking time in a habituation study. A standard backpropagation network with 4 input units (one for each feature) and 4 output units (one for each feature) plus 3 hidden units is trained to reproduce the two patterns in the familiarisation set. The error for the test set (correlated, uncorrelated, and novel patterns) at two stages in training is shown in Figure 3. These stages correspond to 16 and 100 sweeps of training respectively, with a learning rate of 0.3 and momentum 0.9.
Figure 3.
Autoassociation error (looking time) for a Minimal 4x3x4 static backpropagation
network model of the infant categorisation task. The “4-month-old” and
“10-month-old” conditions correspond to 16 and 100 sweeps of training
respectively.
2.3. Model results
Let us assume the earlier stage of training stands for 4-month-old categorisation behaviour and the later stage of training stands for 10-month-old categorisation behaviour. The fit to the empirical data is not terrific for this Minimal model, but it nevertheless exhibits two of the main features of the data: (1) reduced looking time in the 10-month-old condition compared to the 4-month-old; and (2) a relative modulation of looking time for the uncorrelated test item between the two ages. The looking time for the uncorrelated item is closer to the correlated item at 4 months, and closer to the novel item at 10 months. In the infant data, this is the modulation that prompted claims for a shift from “featural” to “correlational” processing. (Note that a network with only 2 hidden units did not show the shift, in terms of the modulation of the uncorrelated pattern. Therefore for the 4-feature version of the categorisation problem, a 4x3x4 network appears to be the minimal necessary architecture).
2.4. Why does the model show the behavioural shift?
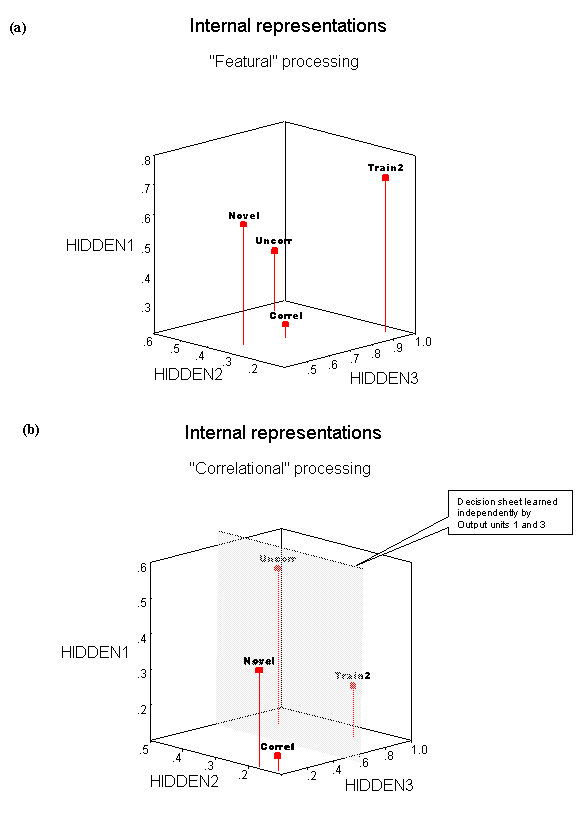
We can plot the activation of the three hidden units for our testing patterns in order to understand the structure of the internal representations that the network forms as it learns. Figure 4 (a) and (b) show how the three test patterns (along with the second training pattern) are represented at the “featural” and “correlational” stages. The hidden unit activations produced by each input pattern are plotted on each of the three dimensions.
Figure 4. Structure of the internal representations
for the minimal network model. Each axis represents the activation of the
hidden units in response to the correlated test item which is also the first
pattern in the training set (Correl), the second pattern in the training set
(Train2), the uncorrelated test item (Uncorrel), and the novel feature test
item (Novel). (a) Internal representations in 4-month-old condition (16 sweeps
of training). (b) Internal representations in 10-month-old condition (100
sweeps of training).
These hidden unit representations are used by the output units to re-create the two training patterns. Each output unit takes a weighted sum of the hidden unit activations, adds a bias and then passes the result through a sigmoid activation function. The values for the biases of the output units are shown in Table 1.
Table 1. Biases (thresholds) for output units in Minimal network model
|
|
Bias value* |
|||
|
|
Output unit 1 |
Output unit 2 |
Output unit 3 |
Output unit 4 |
|
-0.7 |
+1.3 |
+0.8 |
-1.7 |
|
|
“10 month old” (100 sweeps) |
1.8 |
2.4 |
-1.8 |
-2.8 |
|
* The bias is mathematically equivalent to the negative of a unit’s threshold |
||||
Biases are a way of implementing the thresholds of these units (mathematically, the bias is equivalent to the negative of a unit’s threshold). For each output unit, the combination of its bias and the weights on the connections it receives has the effect of placing a decision “sheet” that cuts through the 3-dimensional representational space. If an item lands on one side of the sheet, the output unit will turn on, if the item lands on the other side of the sheet, the output unit will turn off. In Fig. 4b, both Output units 1 and 3 independently place their sheet at the same position in representational space, cutting the space in half. The two units actually orient the sheet in opposite directions. If an item lands towards the back part of the space (i.e., Hidden unit 3 is activated), Output unit 3 will be turned on. Output unit 1, on the other hand, has its sheet the other way round and will be turned off by this item. Output units 2 and 4 don’t generate a decision sheet in the representational space – instead Output unit 2 is simply always on and Output unit 4 always off whatever the activity of the hidden units. At the earlier stage of training depicted in Fig. 4a, none of the Output units is able to manoeuvre a decision sheet into the representational space, since at this stage they have not learned the appropriate weights and bias values.
This sounds complicated – it’s not. The network has learnt the following solution: the default state is to output the first training pattern (even if there is no input!) The biases in Table 1 for 100 sweeps demonstrate this: they reflect the feature pattern of the first item <1, 1, 0, 0> in their signs <+, +, -, ->. This is the activity state of the Output units when there is no external input. However, during training Hidden unit 3 has been tuned to detect the second training pattern. Whenever Hidden unit 3 is activated, Output unit 1 is turned off and Output unit 3 is turned on (using the decision sheet), so transforming the default state into the output <1, 0, 1, 0>, the second training item.
2.5. Mystery revealed
Here is the nub. What has changed about the state of the network that shifts it from the “featural” state to the “correlational” state? Two things. First, the respective similarity of the test items has been altered – in Figure 4, the correlated and uncorrelated items move further apart in representational space (become less similar) as the network is trained. Second, the thresholds of the output units are shifted, allowing sharper discriminations to be made in this representational space [A combination of larger weights and a larger bias, positive or negative, allows a processing unit to make finer discriminations between activation states using a sigmoid activation function.] If this simple network were truly a model of infant categorisation, the explanation of the shift from “featural” to “correlational” processing would be that a 10-month-old achieves more sweeps of learning (or undergoes more representational change) during exposure to a familiarisation set than does a 4-month-old.
Using the non-developmental mathematical model in Section 1, we established that, in principle, a shift from “featural” to “correlational” could be achieved either by a change in threshold or by a change in similarity in how the test items are represented. In the implemented developmental network, the shift involved both elements: Table 1 demonstrates a change in thresholds, while Figure 4 shows a change in similarity in the encoding of the items.
Importantly, note that whatever the stage of training, each hidden unit in the network establishes its activation state by combining the activity reaching it from the input units, and each output unit establishes its activation state by combining the activity reaching it from the input units. That is, at all times, processing is driven by combinations (or correlations) of information. At no stage is processing driven by features alone. [Processing by features alone would require direct connections between input units and output units which, as Shultz and Cohen (2004) point out, would trivialise the task of autoassociation, since the network could just set the direct unit-to-unit connections to 1. The point of autoencoder models is that autoassociation must be achieved via an internal representational resource to drive the emergence of abstract categories.]
In short, the behavioural description of a shift from “featural” to “correlational” processing is not reflected in the underlying mechanism, where continuous changes in a correlational system exhibit the same behaviour. The Minimal model illustrates in concrete terms the claims made by all of the three proposed models of infant categorisation (Gureckis & Love, 2004; Shultz & Cohen, 2004; Westermann & Mareschal, 2004). These models establish the viability of the theoretical claim. Its veracity must be established by further empirical work.
3. Exploring the Minimal model
The Minimal model was run on Tlearn. This is a widely available, free, and easy-to-use network simulator (see http://crl.ucsd.edu/innate/tlearn.html and Plunkett & Elman, 1997). The relevant files for the model to run on Tlearn are included below.
Tlearn requires three files to specify a model: a configuration file to specify the network architecture, a data file to specify the input set, and a teach file to specify the target outputs. To run the Minimal model in Tlearn, open a new project, and copy the following text into the configuration, data, and teach files, respectively, and save each file. In training options, set the learning rate to 0.3, the momentum to 0.9, select train randomly with replacement, and set the random seed to 8277. Train for 16 sweeps for the 4-month-old condition and 100 sweeps for the 10-month-old condition. To run the network on the test items, create a test data file as below and select this file from the testing options menu. See Plunkett and Elman (1997) for an introduction to the modelling of developmental phenomena with Tlearn and a detailed tutorial.
Configuration file:
NODES:
nodes = 7
inputs = 4
outputs = 4
output nodes are 4-7
CONNECTIONS:
groups = 0
1-3 from i1-i4
4-7 from 1-3
1-7 from 0
SPECIAL:
selected = 1-7
weight_limit = 1.00
distributed
2
1 1 0 0
0 1 1 0
distributed
2
1 1 0 0
0 1 1 0
distributed
4
1 1 0 0
0 1 1 0
1 0 1 0
1 0 0 1
Try running the network with only 2 hidden units using this configuration file:
NODES:
nodes = 6
inputs = 4
outputs = 4
output nodes are 3-6
CONNECTIONS:
groups = 0
1-2 from i1-i4
3-6 from 1-2
1-6 from 0
SPECIAL:
selected = 1-6
weight_limit = 1.00
4. References
Gureckis, T. M., & Love, B. C. (2004). Modeling categorization behaviour into adulthood. Infancy, 5(2), 173-198.
Hinton, G. E. & Sejnowski, T. J. (1986). Learning and relearning in Boltzmann machines. In D. E. Rumelhart, J. L. McClelland, and the PDP Research Group, Parallel Distributed Processing: Explorations in the Microstructure of Cognition, Vol. 1: Foundations (pp. 282-317). Cambridge, Massachusetts: MIT Press.
Plunkett, K., & Elman, J. L. (1997). Exercises in rethinking innateness: A handbook for connectionist simulations. Cambridge, Mass.: MIT Press.
Shultz, T. R., & Cohen, L. B. (2004). Modeling age differences in infant category learning. Infancy, 5(2), 153-171.
Thomas, M. S. C. (2004). How do simple connectionist networks achieve a shift from “featural” to “correlational” processing in categorisation? Infancy, 5(2), 199-207.
Westermann, G., & Mareschal, D. (2004). From parts to wholes: Mechanisms of development in infant visual object processing. Infancy5(2), 131-151.
Younger, B. A., & Cohen, L. B. (1986). Developmental change in infants’ perception of correlations among attributes. Child Development, 57, 803-815.